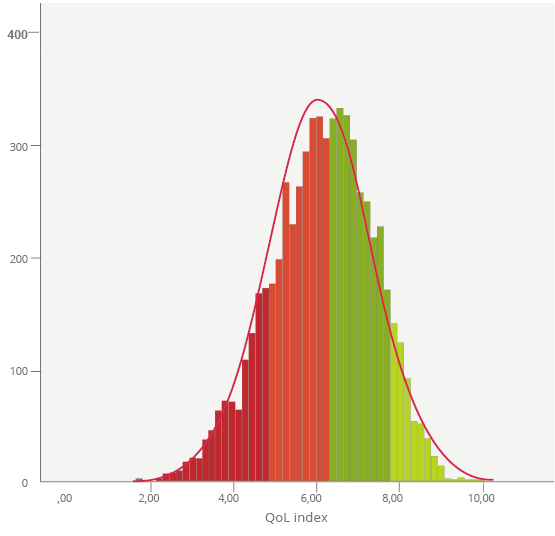
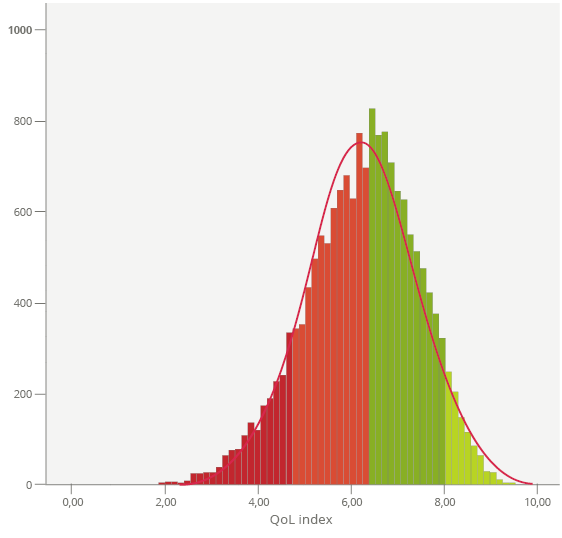
Looking at the histograms, it is apparent that very few respondents score very badly:
- 2009 & 2011 no-one scored below 1,75/10.
- 2011 (after financial crisis) 0.5% scored 2,72 /10.
- This approach to measuring quality of life shows that delivery of infrastructure and services has had a wide reach and helped many.
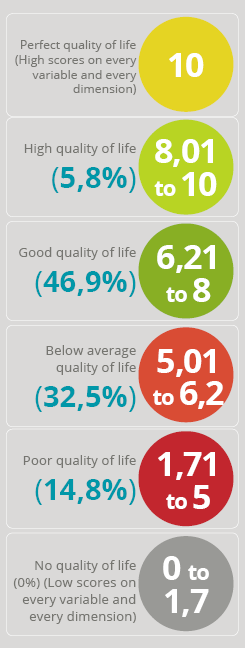
- At the opposite end of the scale, it is also clear that in both 2009 and 2011, the GCR had people enjoying a good to high quality of life. 6% of respondents scored 8 out of 10 or higher, indicating the way in which quality of life in the city-region leans towards the higher end of the scale.